

Part 2 -Sugar Hill is Growing Slower Than Ever
What about housing, permits, rezonings and annexations?

In part 1 of looking at Sugar Hill’s current growth, we looked at how the population growth rate is at the slowest in history by a large margin and what is happening to local school enrollment.
This article will look closer at data centered around land development. Envision100, the city’s most current comprehensive plan contains a lot of information on development.

The one particular chart related to Sugar Hill’s growth slowing significantly is the total number of housing units built, regardless of type.

Of the approximately 9,500 total housing units built in Sugar Hill since 1970 (55 years), more than half were built in the 1990s and 2000s. And, in reality due to the great recession, the vast majority were built in a 15-year period from 1991-2006. As covered in Part 1 of this article, it was also when the city’s population was increasing 15% each year! There was no bigger boom time or time of change than that period in the city’s history. We added exclusively single family detached lots in auto dependent neighborhoods with virtually zero commercial growth. This led to the congestion that we’re dealing with today on our roads. That’s not a value judgement - I live in one of those houses built in that period - it’s just the nature of that development pattern.
Single Family Permits
Looking at permits issued for single family construction of all types tells a similar story. Here it is presented by year.
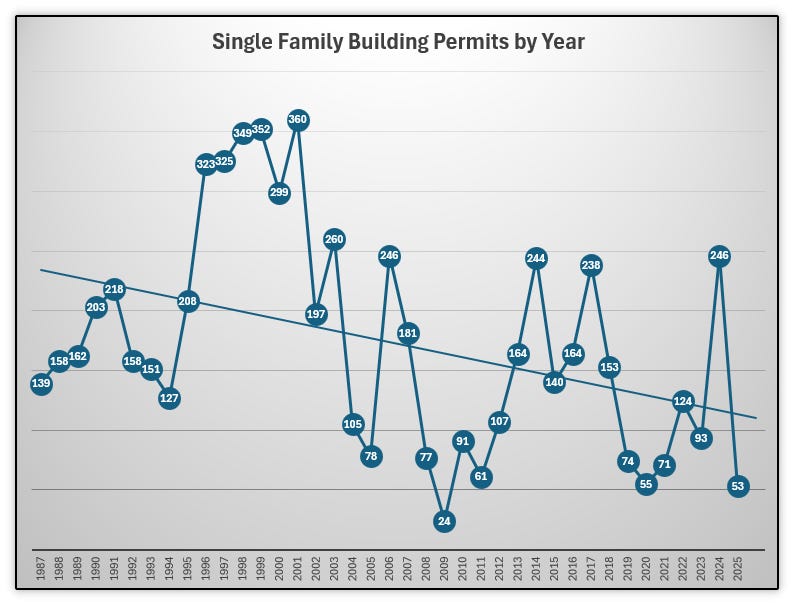
The trend line has been a fairly sharp decline for some time now, despite highs of over 230 permits in 2014, 2017 and 2024. The average number of building permits from 1991-2006 (prior to the great recession) was 232 permits per year. From 2012 (the end of the great recession) to 2024, the last year for complete data, the average is 144 permits per year.
Keep in mind that the population of the city in 1990 was 11,399 and 218 permits were issued. That’s 19.1 single family permits per 1,000 residents. In 2000, when 360 permits were issued, the population was 18,522. That’s 19.4 single family permits per 1,000 residents. If we assume a population of 25,889 (last population count from the census through July 2023) in 2024, that translates to just 9.5 single family permits (again of all types) per 1,000 residents. Or less than half the number of permits issued per resident in 1990 and 2000 in 2024. And 2024 was a relatively strong year for permits at 100 more than the 2012-2024 average.
The 53 permits issued in 2025 is through the end of February.
Rezonings
The one item that usually draws the most attention are rezonings. Below is a graph of rezonings over the years - this is inclusive of all rezonings in the city regardless of it being commercial, residential or industrial and regardless of it being approved or denied. The way rezonings were calculated from 2000 to present is if the city issued a rezoning number. Prior to 2000, the data was taken from a data table the city maintains. There are some instances in which a rezoning number (i.e. RZ-24-001) was issued but it was actually a change in conditions for a prior rezoning. That was still counted in the rezoning totals.
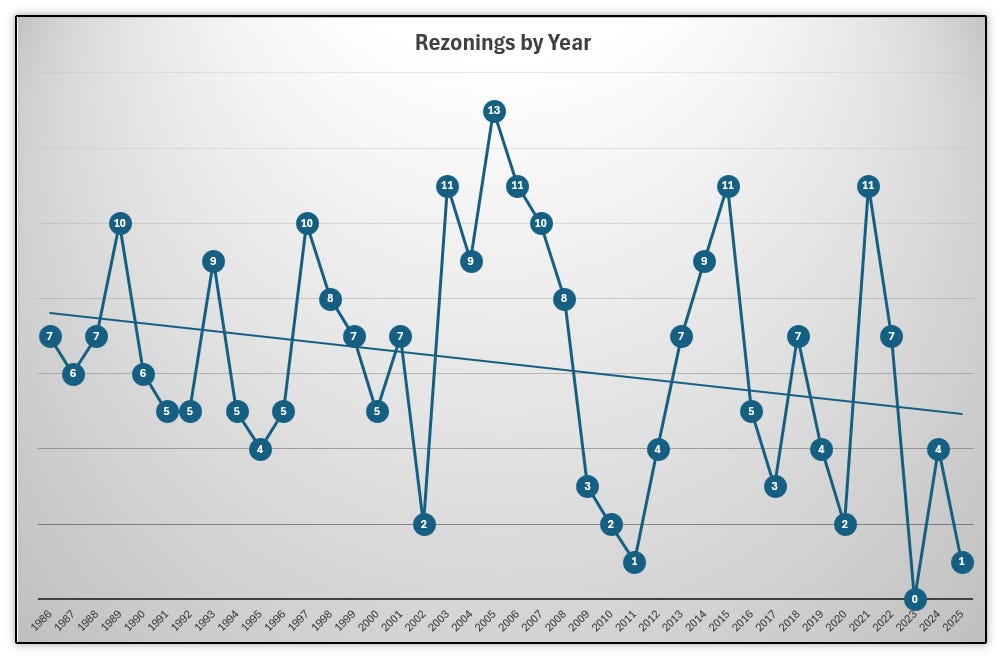
Again, the trend line is down for rezonings. Looking at the boom period of 1991-2006, there was an average of 7.3 rezonings per year. From 2012-2024 the average has been 5.7 rezonings per year.
Annexations
An annexation is when property in unincorporated Gwinnett County is brought into the City of Sugar Hill city limits. Below is a graph of annexations over the years - this is inclusive of all annexations regardless of them being approved or denied. The way annexations were calculated from 2000 to present is if the city issued an annexation number. Prior to 2000, the data was taken from a data table the city maintains.

Like building permits and rezonings, the trend line is down. The average number of annexations during the boom of 1991-2006 was 7.1 annexations per year. From 2012 to 2024, the average was 2.4 annexations.
In a separate article devoted to housing in Sugar Hill, which is a different all be it connected issue to Sugar Hill’s slowing of growth, we’ll cover the different types and number of housing types built in the city.
Land Disturbance Authorizations
Perhaps the most visibly obvious signs of growth is earth moving - land disturbance authorizations. There are typically what generates the “what’s being built there?” question.

The city’s available records go back to 1993, which is a couple of years short of the 15-year boom period. During the 1993-2006 boom, the city average 21.6 land disturbance authorizations per year. During the period of 2012-2024, the average has been 11.8 land disturbance authorizations per year. The trend line clearly down.
What Does This Mean?
There is no “good or bad” to what this means. Some will find it good, others will find it concerning. Growth in a city is important to long term financial success. A city can certainly grow too fast to keep up with infrastructure.
There is no “status quo” option.
Why is that? Why can’t things “stay the same”? As humans, we’re constantly changing ourselves. At the most fundamental level, you age. As you age, your needs change so you modify your environment around you to accommodate your stage in life. As a young adult setting out on life, you likely need a small place like an apartment or starter home. As middle age approaches, you may start a family so a larger home may be necessary to accommodate children, pets and all the modern “stuff” of family life. As empty nesters, you may return to a smaller home but maybe nicer than a small starter home or apartment. As seniors, independent living or age restricted single story homes may become attractive. At advanced age, you may require assisted living accommodations. This is the circle of life and important to an age in place community. If things are “status quo”, many of those housing options may not be available - either they don’t exist at all or are in limited supply such that they’re not available or cost prohibitive due to demand. And this only covers the most basic fundamental of the human life - aging. Providing those basic housing types at a quantity sufficient for you to age in place requires growth - assuming you want to sell that starter home for the larger home and so on.
The leaves another option - a dying city in which the population is declining. It doesn’t take much imagination to understand what that means to a city.
While Sugar Hill’s growth has dramatically slowed over the boom of 1991-2006, we continue to grow, all be it at a much, much slower pace. The growth we’ve seen in the last decade has been to add those housing types that allowed many in our community to age in place along with new commercial growth. That’s important to becoming a strong community.