

The 1998 Comprehensive Plan was Wild
It projected over 5,000 multi-family units and a population of 55,000 in 2020 in Sugar Hill.

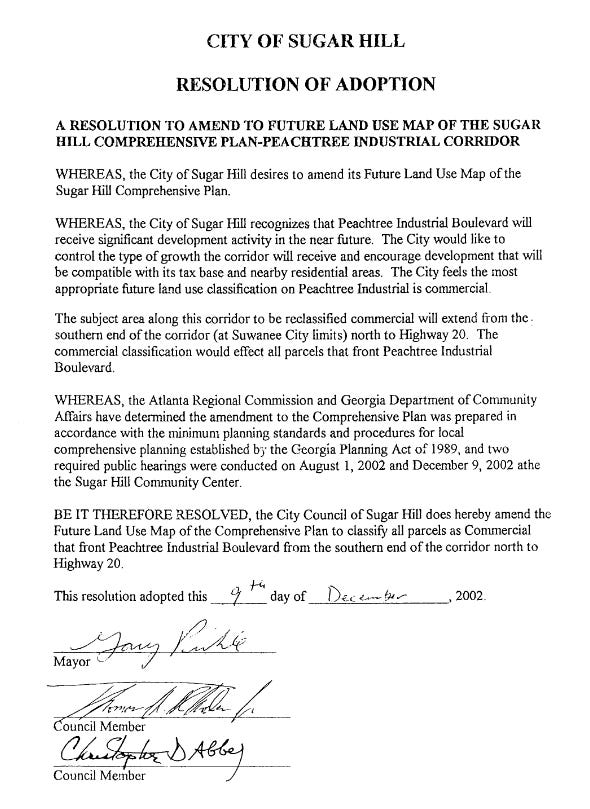
Even though the 1998 Comprehensive Plan for Sugar Hill was replaced in 2005 there are a few nuggets in it that are worth pointing out.
First, it was amended in 2002 with some additional maps and data and re-approved by Mayor and Council (of which two members currently serve on city council).
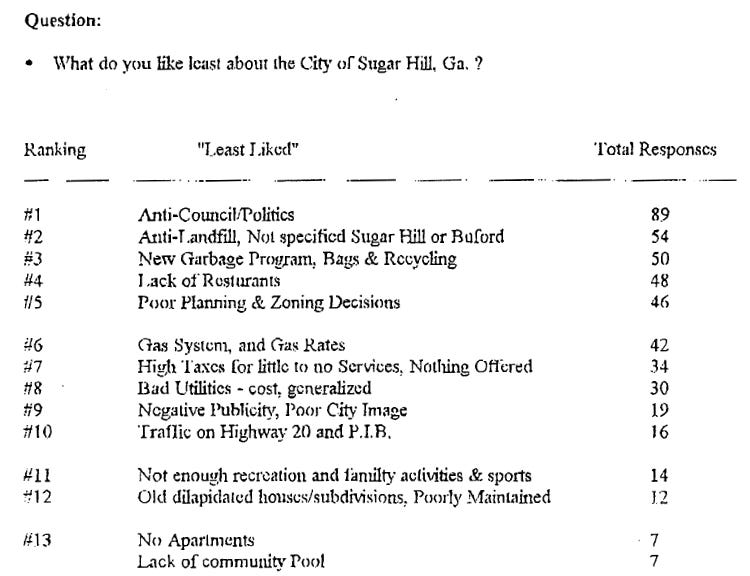
The more things change, the more they stay the same. Under the question of “What do you like least about the City of Sugar Hill, Ga?”, coming in at number 3 was the “new garbage program, bags and recycling”. Sounds familiar, right?
However, there are some wild charts and data in the plan that are worth sharing, particularly where the city would be in 2020.
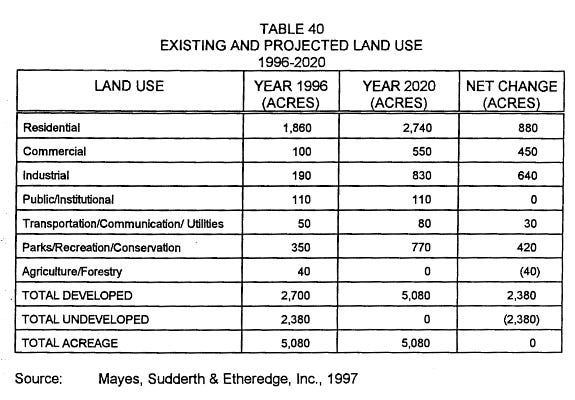
On page 55, Table 40 indicates that the city would be completely developed by 2020. In fact, it would have zero (yes, zero, 0, zilch, nada) undeveloped acres in 2020. More than 880 acres of new residential development would be added, an additional 450 acres of commercial would be added and an incredible 640 acres of industrial would be added.
Meanwhile, apparently, no public or institutional land use would be added. By the way, public/institutional includes local government uses, libraries, schools and churches. And apparently all this growth would happen and only 30 acres of transportation and utilities would need to be added.
Well, you might be curious, if such an aggressive use of land was actually realized, what would that mean for the city itself from a population standpoint? Table 5 has that answer.
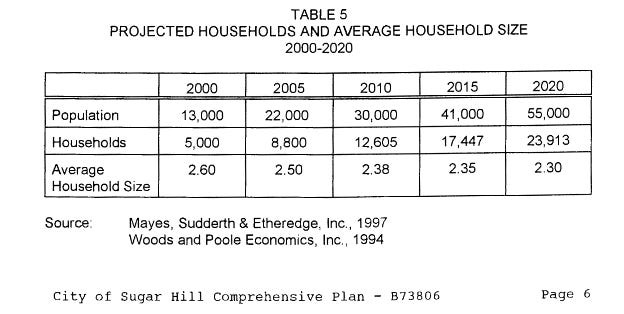
You read that right - the population of the city in 2020 would be 55,000 strong. With an astounding 23,913 households.
What was the actual population of Sugar Hill in 2020? According to the Census Bureau it was 25,076. The 1998 Comp Plan anticipated the city hitting the actual 2020 number around 2007. This plan anticipated the city doubling in size in 7 (!!) years.
According to Envision 100, the city’s most recent comprehensive plan, the total housing units in 2020 was around 8,000. This plan expected to hit the total number of households we have today before 2005. Wild.
You might wonder what the composition of those nearly 24,000 units would be. Well, Table 38 lays it out.
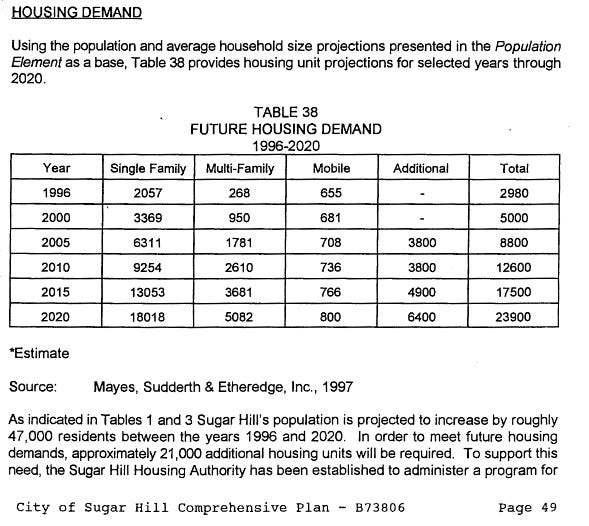
Keep in mind that the city currently has 8,000 households (of all types). In 2020, the Comp Plan anticipated over 18,000 single family homes alone and more than 5,000 multi-family units. Remember, the plan only anticipated a total of 30 acres of transportation and utilities to accommodate this growth. In fact, the city was projected to add 6,400 units between 2015 and 2020, including 5,000 single family homes. That’s an average of almost 3 new homes per day, every single day, for 5 years.
If you think that’s crazy, let’s do some density math. Remember the anticipated new residential acreage from Table 40 is 880 acres between 1996 and 2020. The projected household increase between the same period is 20,920 units from Table 38. Divide the two to get the density: 20,920 units/880 acres = 23.8 units per acre. For reference, the maximum density allowed in townhome developments is 8 units/acre. And that’s rarely achieved.
Below is a link to download this document in its entirety. Safe to say, we’re glad that the city turned away from this document in 2005.
At the same time, it’s fair to ask: Was anyone paying attention to this document before it was passed - twice?